
Analytics
Track employee engagement.
Overview
Visualise employee engagement through understanding attendance to routine Morning Briefs and task completion. Using filters, data can be manipulated to understand trends in employees input into Fraim. Find trends in the data to understand your workforce.
Dashboard
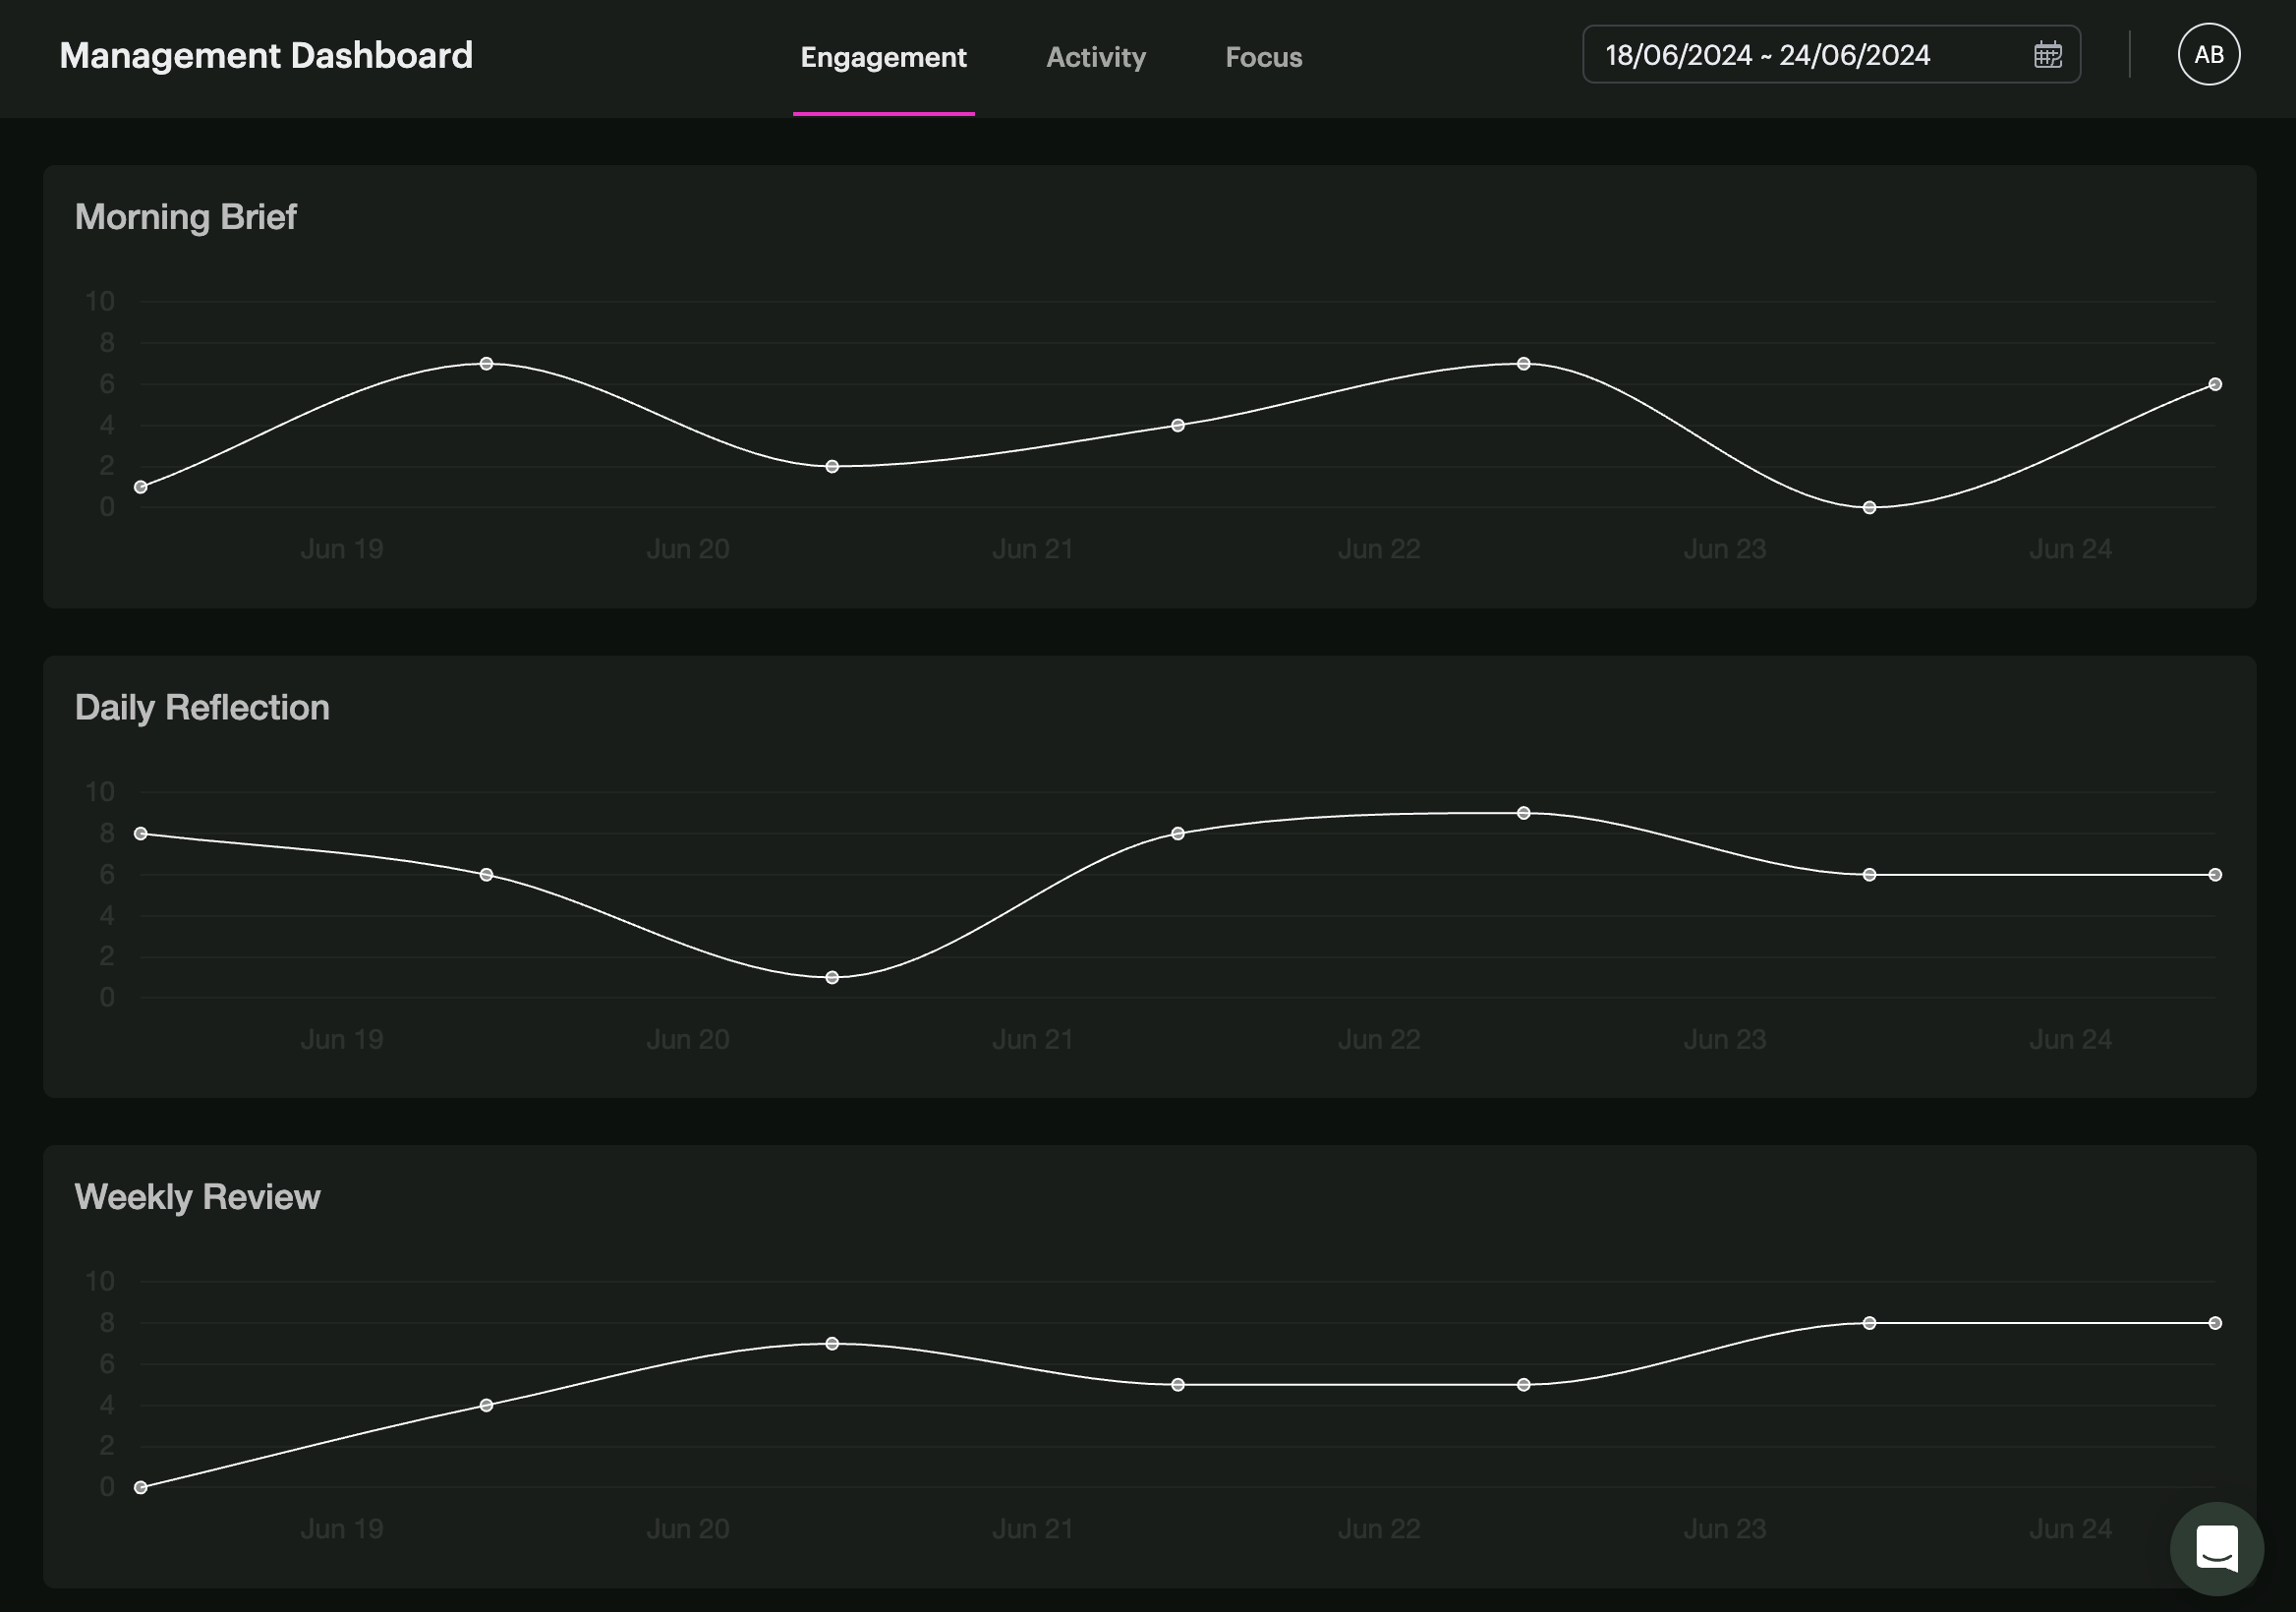
Engagement
The data showcased in the engagement and activity graph suggest a strong correlation to employees engagement by highlighting weekly rhythms across teams. By utilising the filters at the top of the page, visualise company behaviours through participation levels with Fraim.
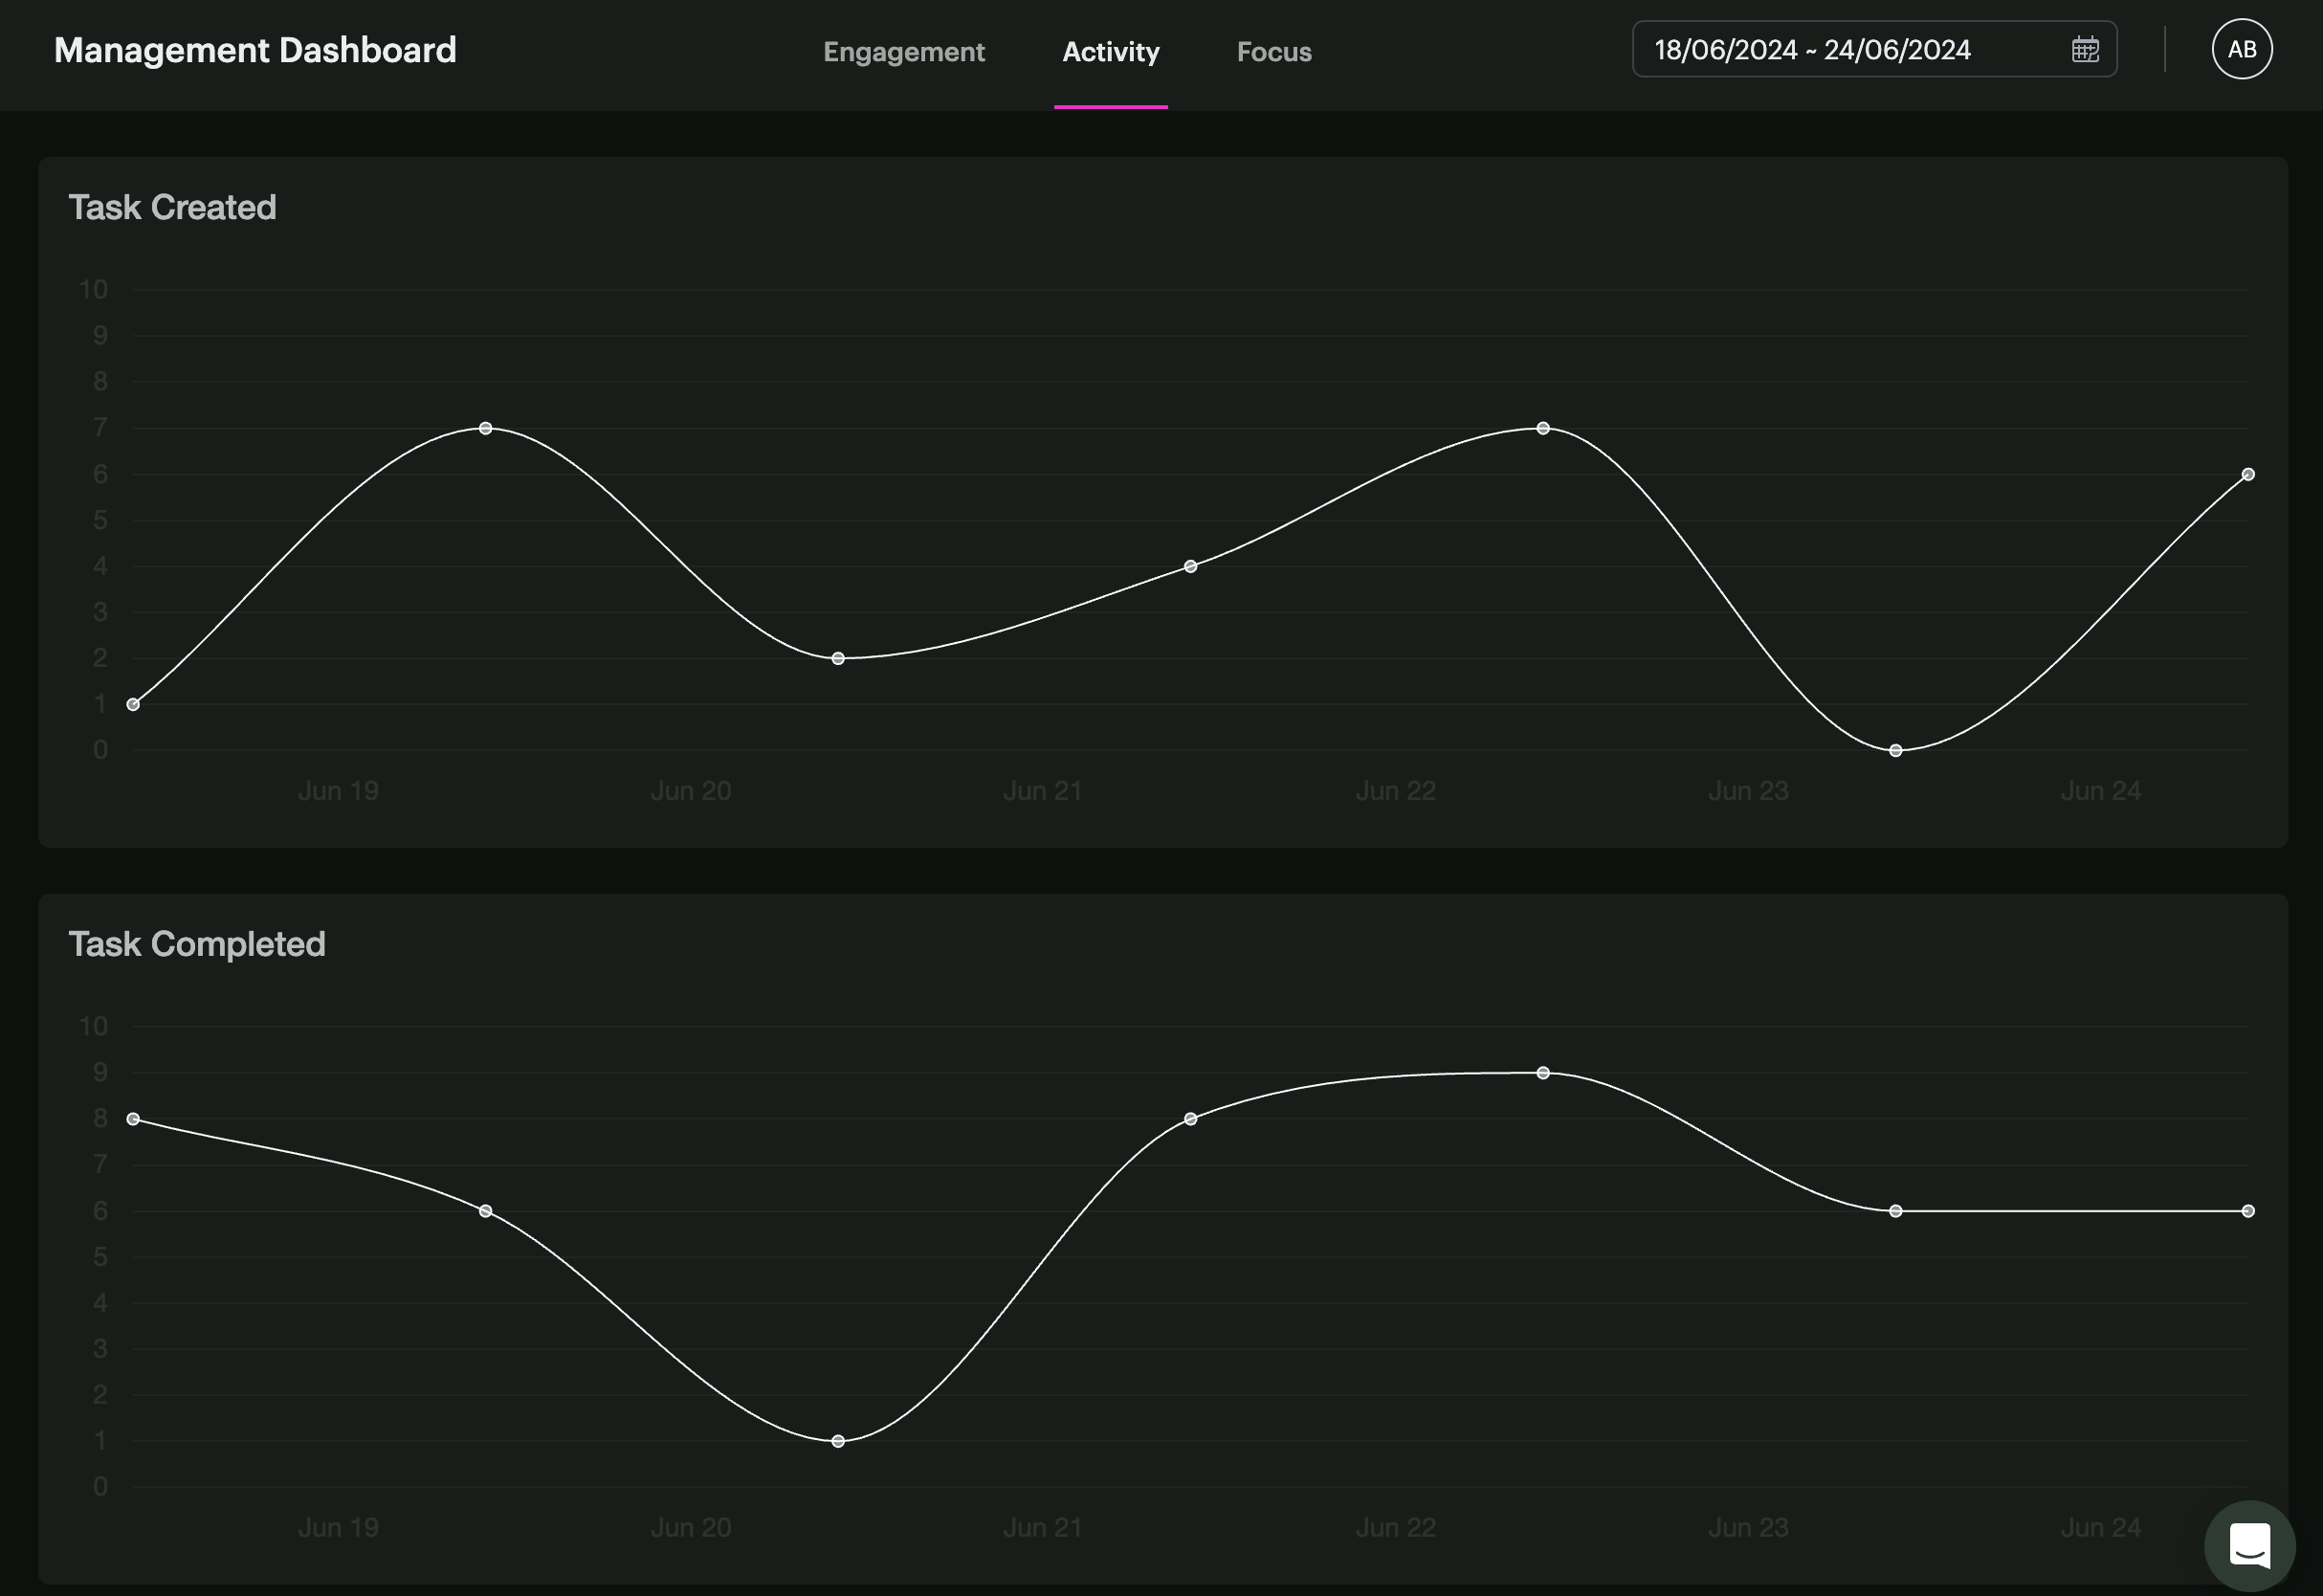
Activity Graph
The activity graph presents the number of created and completed tasks per day. This is a great way to visualise the input from your team members.
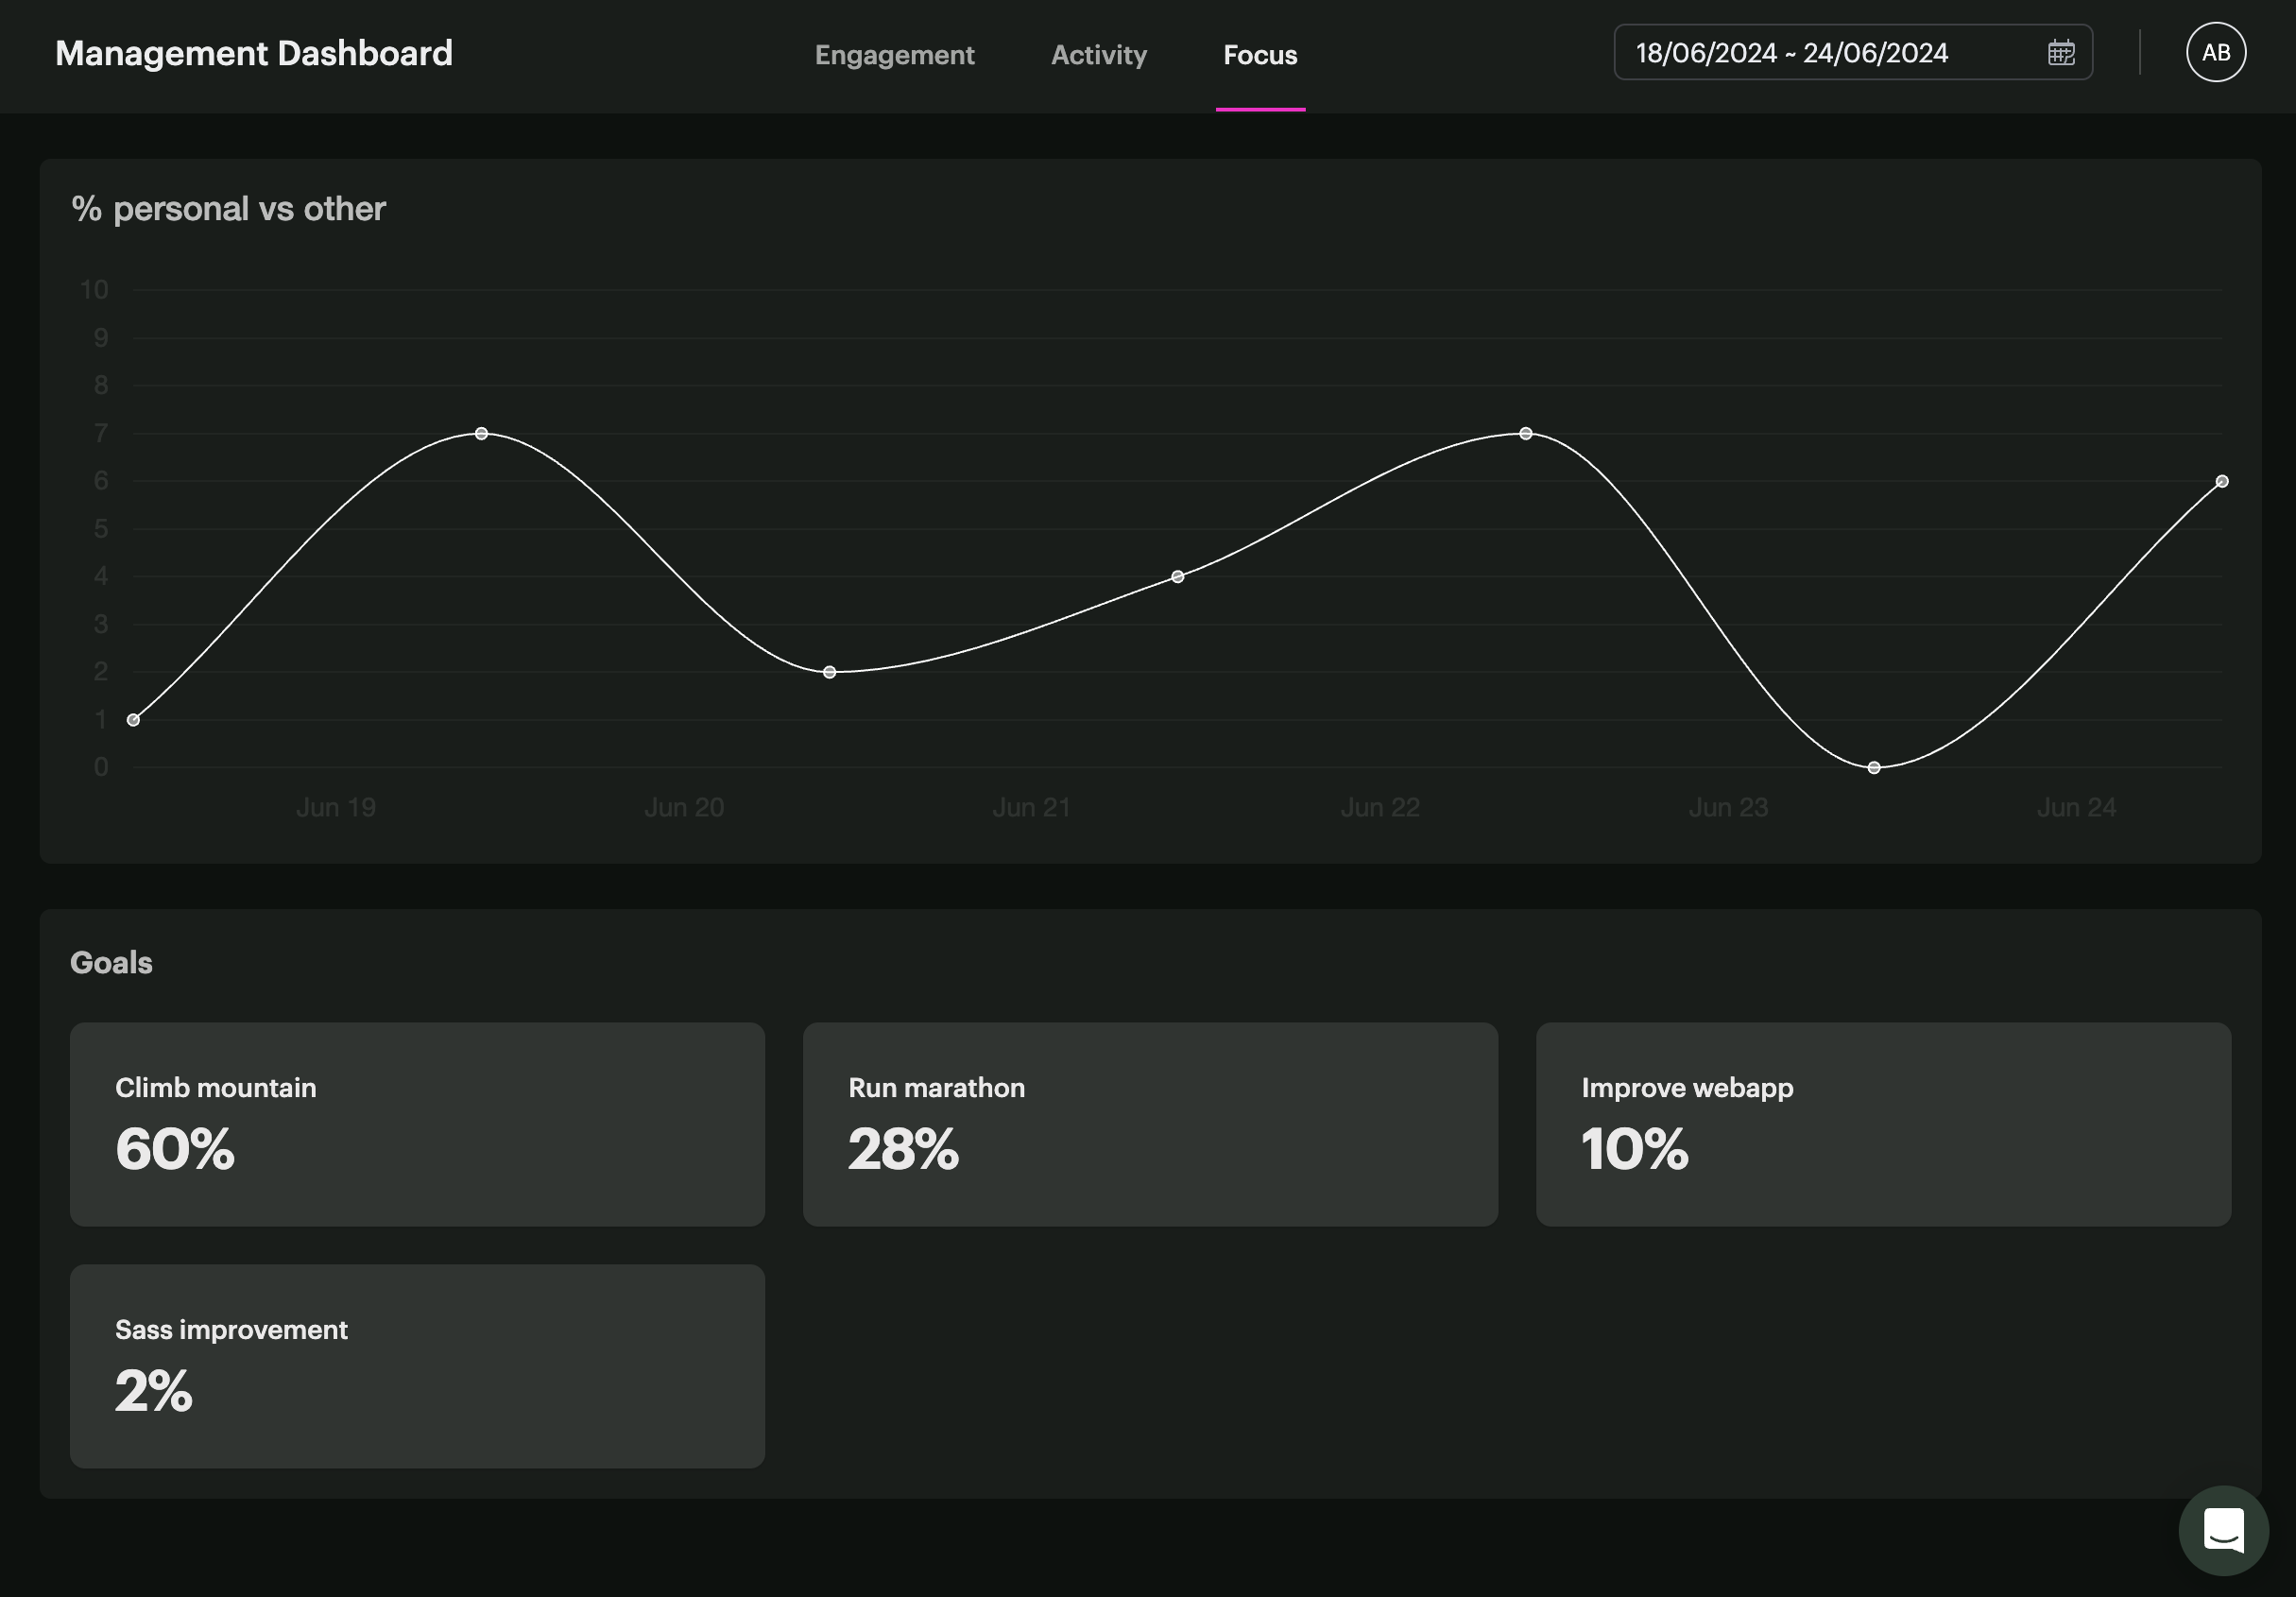
Focus Graph & Goal Cards
The focus graph showcases a visualisation of your team’s personal goals vs other goals. The goals cards give you a high-level overview of the percentage of focus that is aligned to each goal.
Currently, the webapp is available to business accounts only.